

How to get it right with market sizing, and why it matters?

One of the most common discussion themes between founders and investors is the market size and the business opportunity behind it. No matter how great the team is and how fantastic the product they deliver, there are few things more frustrating than a market that just isn't big enough. In this article, we discuss how to estimate our company's end-game market size and, therefore, valuation potential if things go well.
Founder and investor perspectives
Investors frequently mention looking for companies with "venture scalability" but rarely explain their rationale to founders. Due to the power law distribution of startup outcomes (many investments failing, a few performing below expectations and only a couple reaching their initially projected size), most VCs aim to be able to return their fund size with every single investment. For instance, a €100M fund expecting to own 10% of the company at exit (starting with 15% but even after some follow-on investments getting diluted in growth-stage rounds) will look at opportunities with €1B exit potential (€1B x 10%=€100M). On the other hand, a €25M fund writing smaller checks and ending up with 5% ownership at exit will set its bar at €500M.
Matching the founder's and investor's viewpoints is vital from the alignment of interest perspective. A risk-return profile of a VC investor is only aligned with founders aiming to create "venture-scale" companies. Those founders are expected to go after very large markets (global or many international ones), therefore taking more risk in terms of execution and fiercer competition. Other founders choosing to compete in a smaller market are better off bootstrapping their businesses or exploring alternative fundraising options (e.g. revenue-based financing or venture debt). A "big enough" outcome for an e-commerce or agency business founder is a great achievement for them. However, it’s misaligned with the objectives of a VC. That is why a key thing an investor wants to confirm when evaluating a startup opportunity is the sizable market.
Methods for market sizing
When running the exercise, it's always best to understand and quantify the market from the most granular data points. This is a bottom-up approach. It’s often the case that founders cut corners and copy-paste some top-down numbers found on the first page of Google Search to their pitch decks. However, it signals to investors that the founder didn't dedicate enough time to deeply understand the market potential for her business model and its underlying dynamics.
Bottom-up market sizing is a better approach because:
- More granular data is more reliable. Looking at the total market size of a specific industry (let's say "Agriculture") can be misleading. We often don't know precisely all of the components it consists of (does it include or exclude things like production output, fertilizers, labour, machinery etc.?). Starting with, say, the number of farms above a certain hector-size in a given country (adjusted for a projected growth/decline rate) is often a more exact starting point. Based on that, we can estimate how large of a GMV our company can achieve based on other company-specific inputs.
By breaking our calculation down into the smallest components, it's easier to understand the sensitivity of market size to specific variables. For instance, one company concludes that the market is too small at its current price point. However, the market can enlarge with additional product features (for which we know customers are willing to pay more). Conversely, another company appeals to early adopters willing to pay a high commission for the service, but certainly, they’ll be forced to decrease the take rates to capture the mass market.
The above exercise can help us better quantify and understand strategic directions for our startup to proceed and maximize its potential.
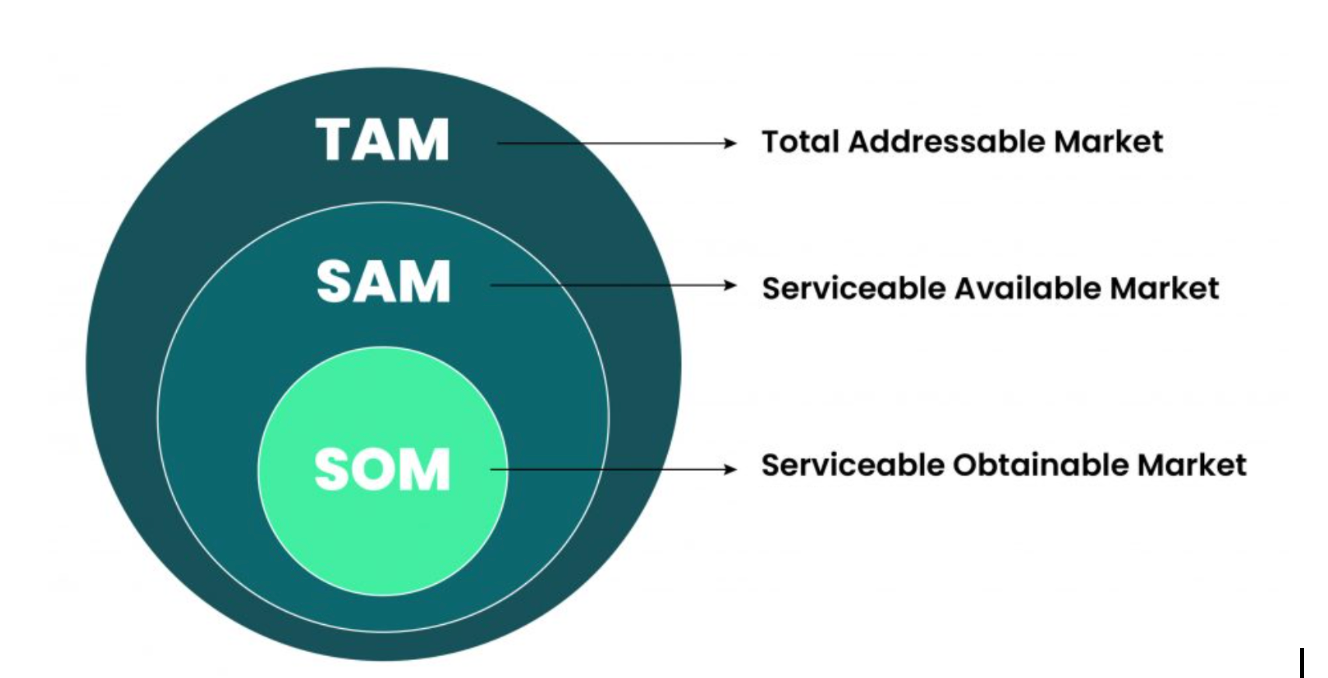
TAMs, SAMs and SOMs
 Source: adapted from https://www.thepowermba.com/
Most founders are familiar with those three-letter acronyms. However, the methodologies for estimating them aren't always consistent between pitch decks. Let's deconstruct those into smaller elements and understand the ways to calculate your market size in a high level of detail:
- Total Available Market (TAM) is the total market demand for a product or service:
TAM = Market (# of customers, growth rate) x Price (extent of competition (1.) , value prop strength, churn/recurrence, conversion rate) x Gross Margin (target COGS/take-rate, extent of competition (2.) ), where:
- Market is understood as the number of potential customers that are potentially willing to buy your product/service. It should be adjusted by the growth rate for the next 5-10 years (bear in mind that fast growth rates usually flatten with time)
- Price encompasses how much you can charge each customer annually. Therefore, pricing depends on competition (how unique our product is) and strength of value prop (how much better/worse our product is than alternatives). Depending on the business model, we also have to consider recurrence (how many times a year someone could purchase something on our marketplace) and churn (how long, on average, will people use our SaaS product)
- In freemium models, we also have to consider what portion of customers will eventually pay for our product at all (conversion rate)
- Many startups disrupt existing markets with both better quality and lower prices. For market size considerations, it's essential to use the new lower price that we will charge
Gross Margin is a percentage of topline revenue that we capture with our take-rate: (commission charged, in case of marketplaces) and after subtracting our COGS (costs directly linked to a specific customer, e.g. logistics, payments or cloud computing, in case of both marketplace and SaaS models). It's critical to remember that those figures will likely change over time. We may get a better logistics deal once we scale. Conversely, we may need to relax our take rates in new markets, where competition is more fierce than in our home market).
- Serviceable Available Market (SAM) is the segment of the TAM targeted by your products and services which are within your geographical reach and target customer segment(s)
SAM = TAM x % of our sweet spot (geography, customer type, customer size), where
% of the sweet spot is split between specific customer categories that we target: (A.) solopreneur vs SMB vs enterprise, or (B.) domestic vs EU vs US, or (C.) company-specific characteristics, e.g. residential vs commercial real estate spaces
There's no one-size-fits-all recipe for segmentation, and each analysis is company-specific. The more granularly we understand it, the better. Different customer segments perceive our value prop differently, adopt products faster/slower, have a higher/lower degree of competition, etc.
- Serviceable Obtainable Market (SOM) is the portion of SAM that you can realistically capture within the next 5-10 years.
SOM = SAM x % target penetration (speed) x % market share (type of market, extent of competition (3.) )
% target penetration indicates what portion of our target market will adopt a solution of our type (ours or competitive) within our target timeframe. It's based on willingness to adopt change (some industries embrace change more willingly than others). Also, sales/R&D cycles vary significantly between companies (usually, Enterprise clients implement solutions slower than SMBs, and deeptech products take longer to be market-ready than tech-enabled products).
% market share is a portion of the market we aim to capture (again, within our target timeframe). It is driven by: the market type (is there a winner-takes-all dynamic/strong network effects?) and competition (how many competitors are there, and how does our value proposition compare to theirs?)
(It's common to see some round numbers as estimates for the two points above. One may say: “we interviewed five potential customers, and three liked our solutions, so there will be 60% penetration, and there are two other competitors, so we'll get 33% market share”. As always, the more nuanced, segmented and thought through our analysis, the better.)
(1.) (2.) (3.) The Extent of competition is mentioned thrice in the formula, and it's not by mistake. While variables (1.) and (2.) depend on our business model (competition impacts our price in the case of SaaS and take-rate in the case of marketplace model), variable (3.) impacts our target market share. In summary, while all other variables impact our revenue linearly, competition impacts it quadratically. We see that a product's low differentiation will eventually both eat into margins and diminish market share capture potential.
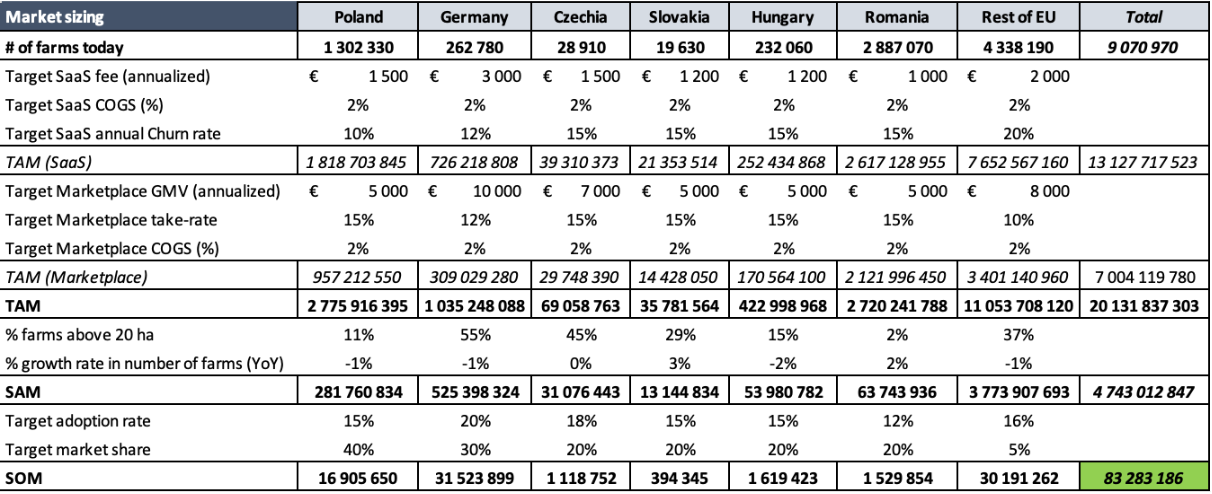
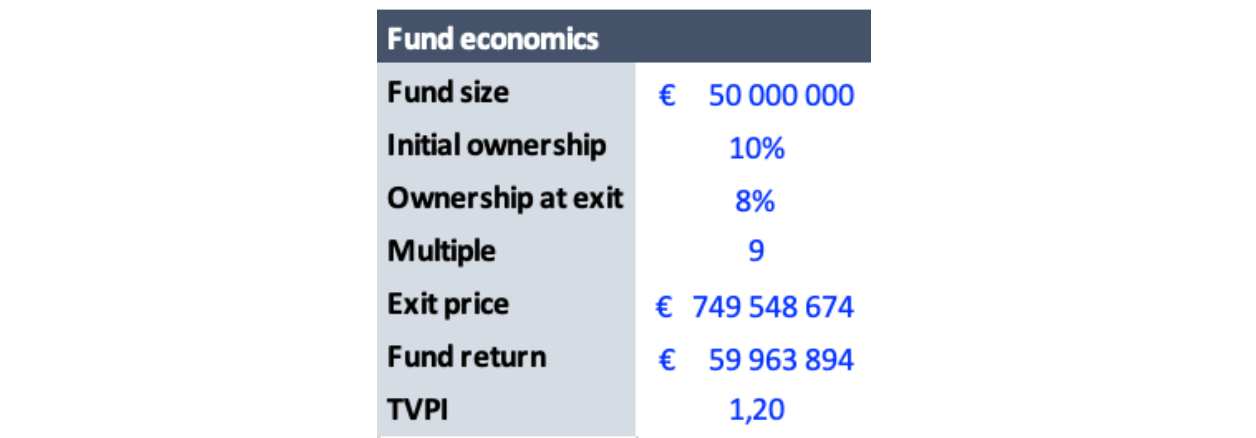
Case study: an Agro startup
We illustrate the above dynamics in this document. It’s a simple market sizing calculation of a (fully fictional) SaaS-enabled marketplace in agro space. They target mid-to-large-size farms to manage their day-to-day operations (vertical SaaS) and sell crops directly to buyers (B2B marketplace). The document is just an example, showcasing a simple, back-of-the-envelope market sizing and fund economics calculation.
Summary
SOM is your ultimate gross margin potential, which investors can use to analyze if the opportunity is sizable enough. They will multiply it by an exit multiple to see if it’s a venture-scale outcome for their fund.
It's not only about getting the number correct but more about the thought process of the founder. The exercise exhibits how well she understands her business model and market from the smallest principles. It can yield multiple benefits for the founder and her company, from a better understanding of potential strategic directions to pursue to the weakest links in the model that require extra focus.
Source of the cover photo: https://www.unsplash.com
Subscribe to newsletter
Get a bi-monthly email with news, interesting reads, and useful tips about startups.More Articles
from our Blog


Supported by InnovFin Equity, with the financial backing of the European Union under Horizon 2020 Financial Instruments and the European Fund for Strategic Investments (EFSI) set up under the Investment Plan for Europe. The purpose of EFSI is to help support financing and implementing productive investments in the European Union and to ensure increased access to financing.
Attention! This investment falls outside AFM supervision. No licence and no prospectus required for this activity!
